
Complete Features & Configuration Guide
Official Documentation for Global Administrators
Table of Contents
1. Installation & Setup
2. Analytics Dashboard & Widgets
3. Data Reports & Grid Views
4. Custom Report Builder
5. Bulk LMS User Importer Wizard
6. Administrative Settings Customizer
7. Shortcodes Reference
8. Developer & Database Reference
1. Installation & Setup
Follow these systematic instructions to install and configure the plugin on your WordPress site:
- 1. Ensure the core LearnDash LMS plugin is installed and activated.
- 2. Upload the ‘users-reporting-for-learndash-pro’ folder to the ‘/wp-content/plugins/’ directory.
- 3. Navigate to WordPress Admin > Plugins and click Activate next to ‘LearnDash Ultimate Reports (PRO)’.
- 4. Any active free version of the plugin will automatically deactivate to avoid conflicts.
Activate Your License Key
Go to LearnDash LMS > LMS Dashboard & Reports > Settings > License Settings to insert the license key sent to you via email. Once verified, click Activate to access automatic plugin updates.
2. Analytics Dashboard & Widgets
The main dashboard overview page compiles key statistics cards and interactive charts. It supports granular widget selection, theme coloring adjustments, and layout configs.
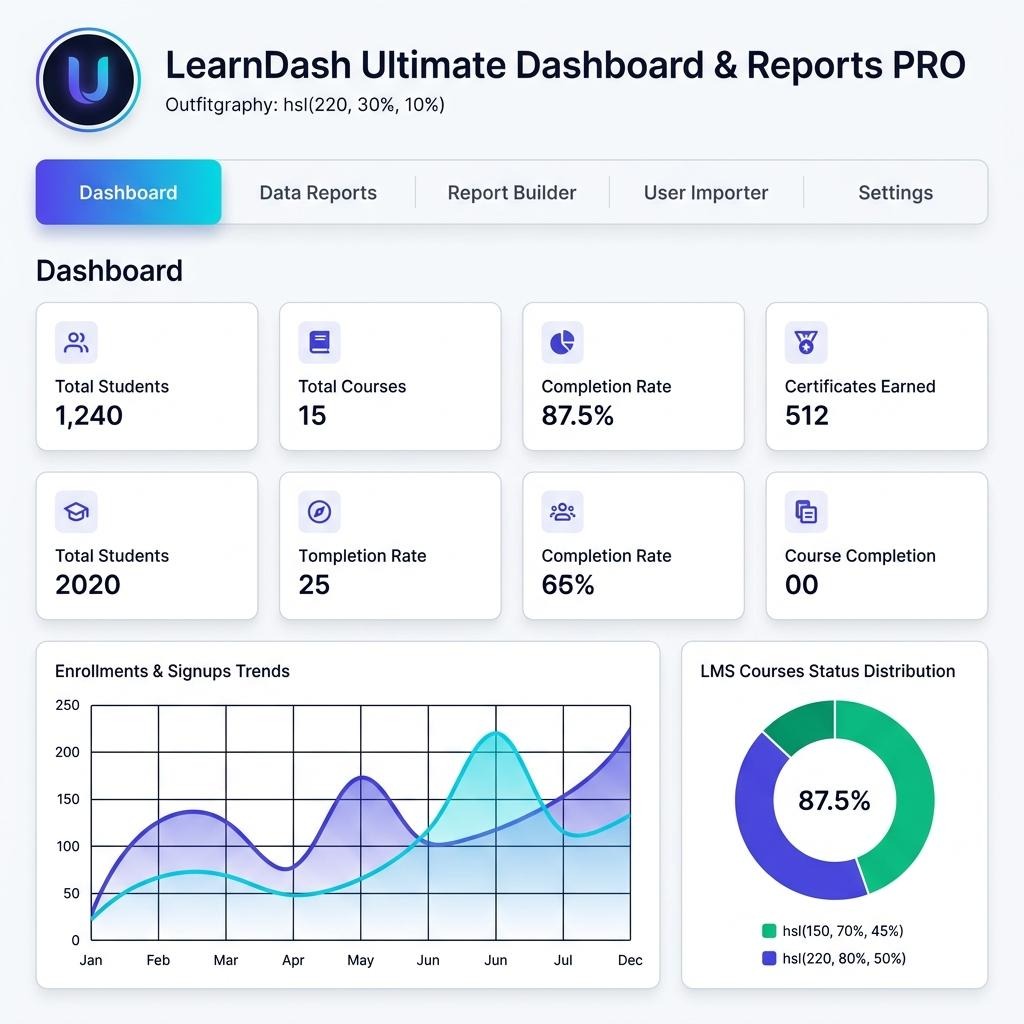
Figure 1: LMS Analytics Dashboard Mockup View
Core Widget Cards
- • Total Students: Cumulative subscriber/student counts.
- • Total Courses: Count of active published courses.
- • Total Groups: Count of active published learning groups.
- • Total Enrollments: Total student-to-course relationships.
- • Completion Rate: Average progress percent of all enrolled courses.
- • Active Students: Number of students actively recording course steps.
- • Certificates Issued: Number of course certificates earned.
- • Quiz Attempts: Cumulative quiz submissions recorded.
3. Data Reports & Grid Views
Data Reports allow administrators and instructors to view tabular details of student progress, enrolled courses, and learning groups.
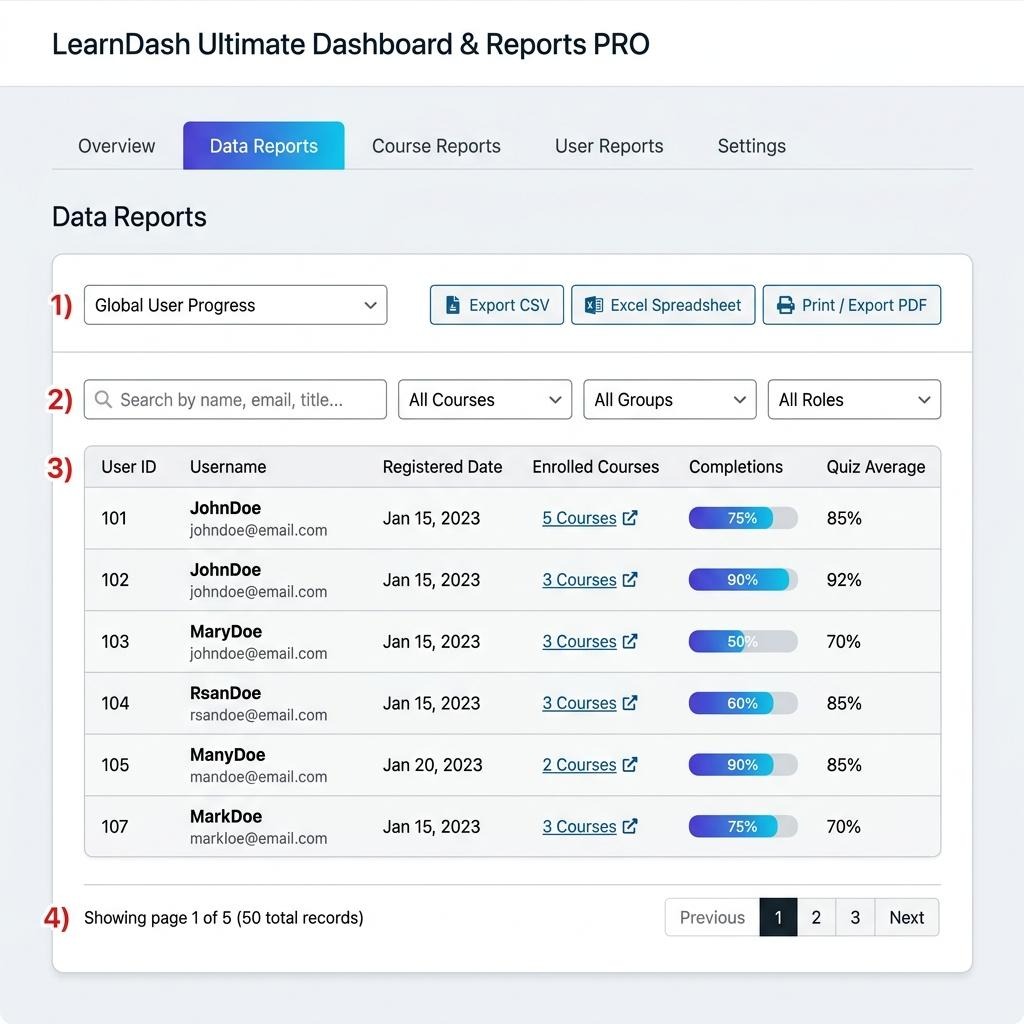
Figure 2: Data Reports Table Interface Mockup
Features and Exporters
- • Live Search & Filter: Instantly search by username or email, and filter grids by course, group, or user role.
- • Progression Percentages: Real-time student progression ratios for enrolled course steps.
- • Grid Swapping: Instantly transition between Students list, Courses metrics, and Groups details.
- • Exporting: Click the generate reports button to export current views to a CSV or Excel-compatible XLSX file.
4. Custom Report Builder
The Report Builder allows administrators to design custom report templates, select specific reporting columns, reorder them, and manage who has viewing access.
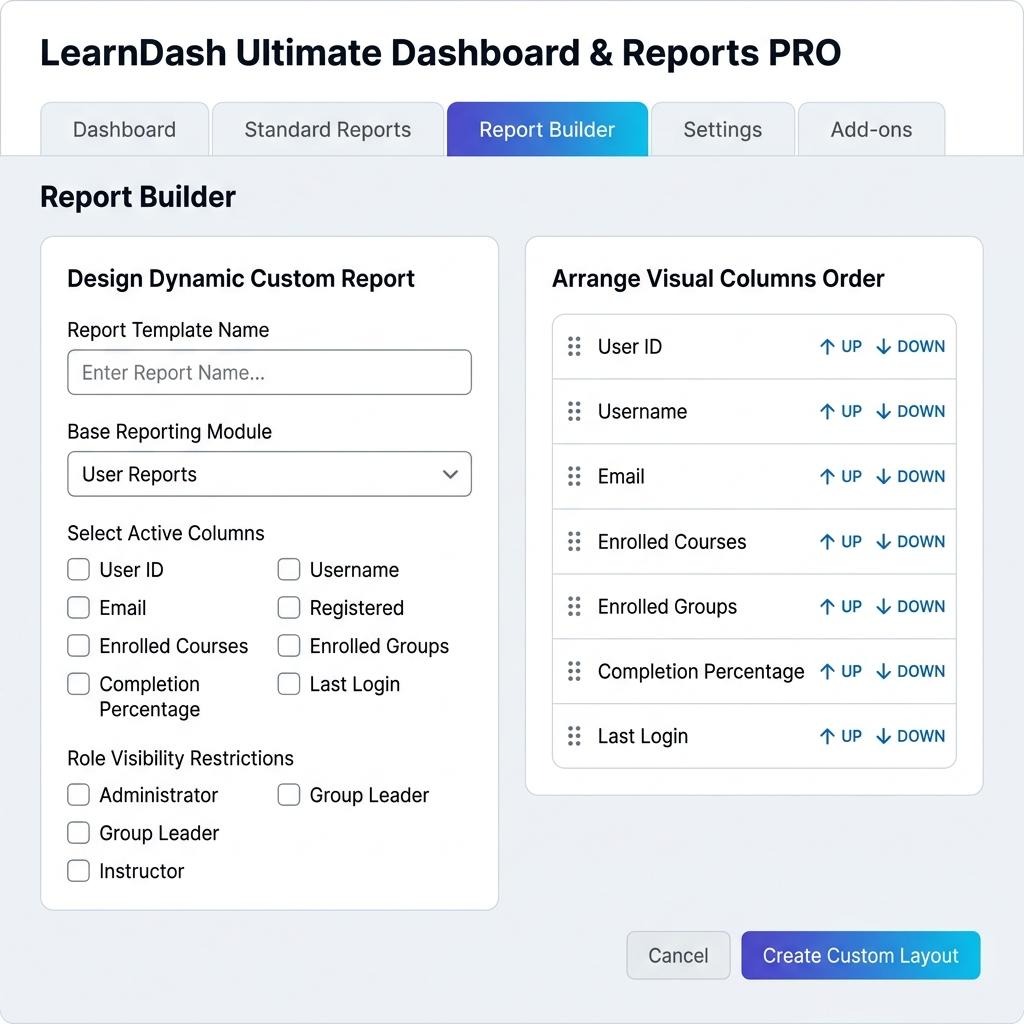
Figure 3: Custom Report Builder Drag & Drop Interface Mockup
How to Build a Custom Layout
- 1. Choose a Base Module: Select from Students Progression, Course Metrics, or Groups Status.
- 2. Select Columns: Choose which columns (e.g. User ID, Quiz attempts, average score) to show in the table.
- 3. Sort Order: Drag and drop columns on the right panel to shift their horizontal alignment sequence.
- 4. Set Visibility: Limit access to Administrator, Group Leader, or Course Instructor.
- 5. Copy Shortcode: Click the copy button to copy the shortcode (e.g. [ld_custom_report id=”5″]) for frontend embedding.
5. Bulk LMS User Importer Wizard
The Bulk Importer handles spreadsheet enrollments, automates group connections, auto-generates credentials, and notifies students.
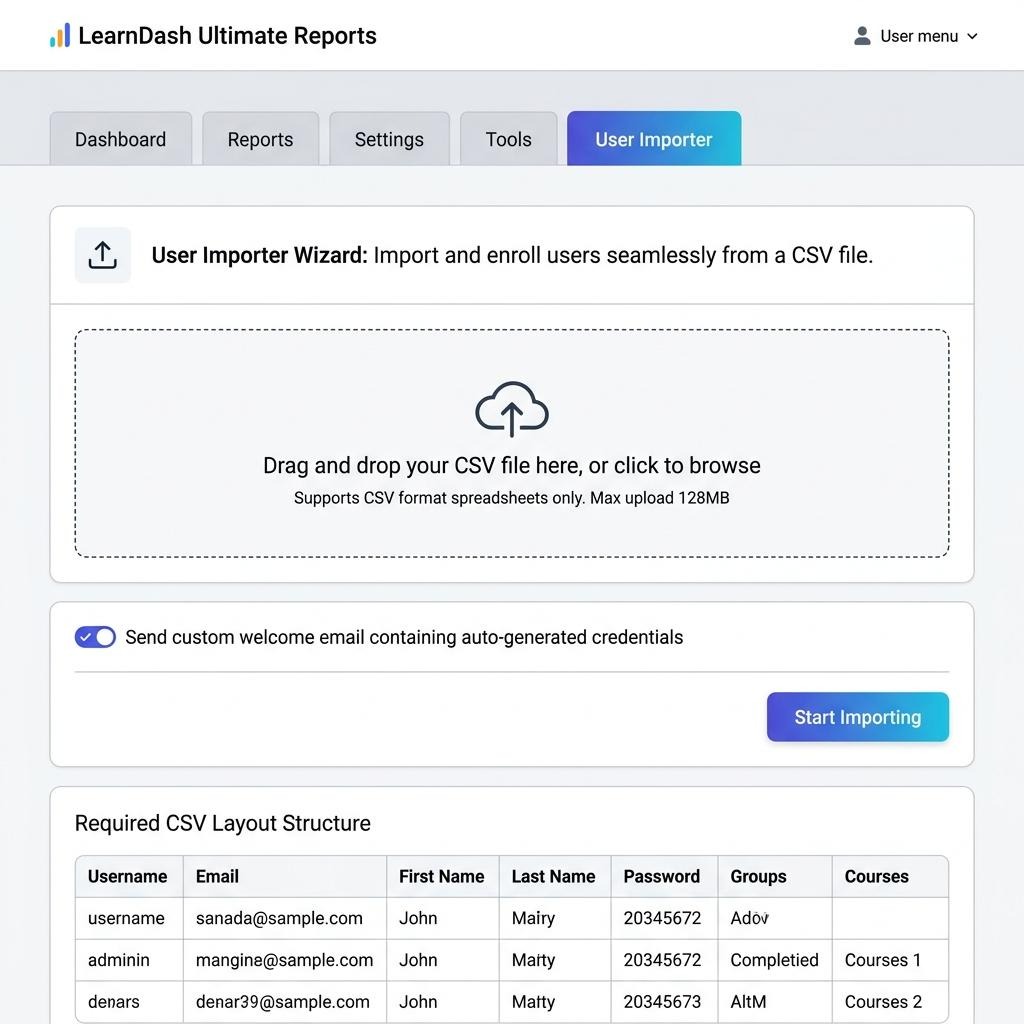
Figure 4: Bulk User Importer Wizard Mockup
Required CSV Table Layout
| Username | First Name | Last Name | Password | Groups | Courses | |
| john_doe | john@test.com | John | Doe | (leave empty) | 54, 88 | 12, 43, 76 |
- • Password: If left blank, a secure 12-character phrase is auto-generated.
- • Groups & Courses: Comma-separated list of numeric post IDs.
- • Welcome Email: Toggling this sends customized welcome emails with login credentials to students.
6. Administrative Settings Customizer
The settings customizer controls active widgets, visual theme styling, pagination, and role-based permissions.
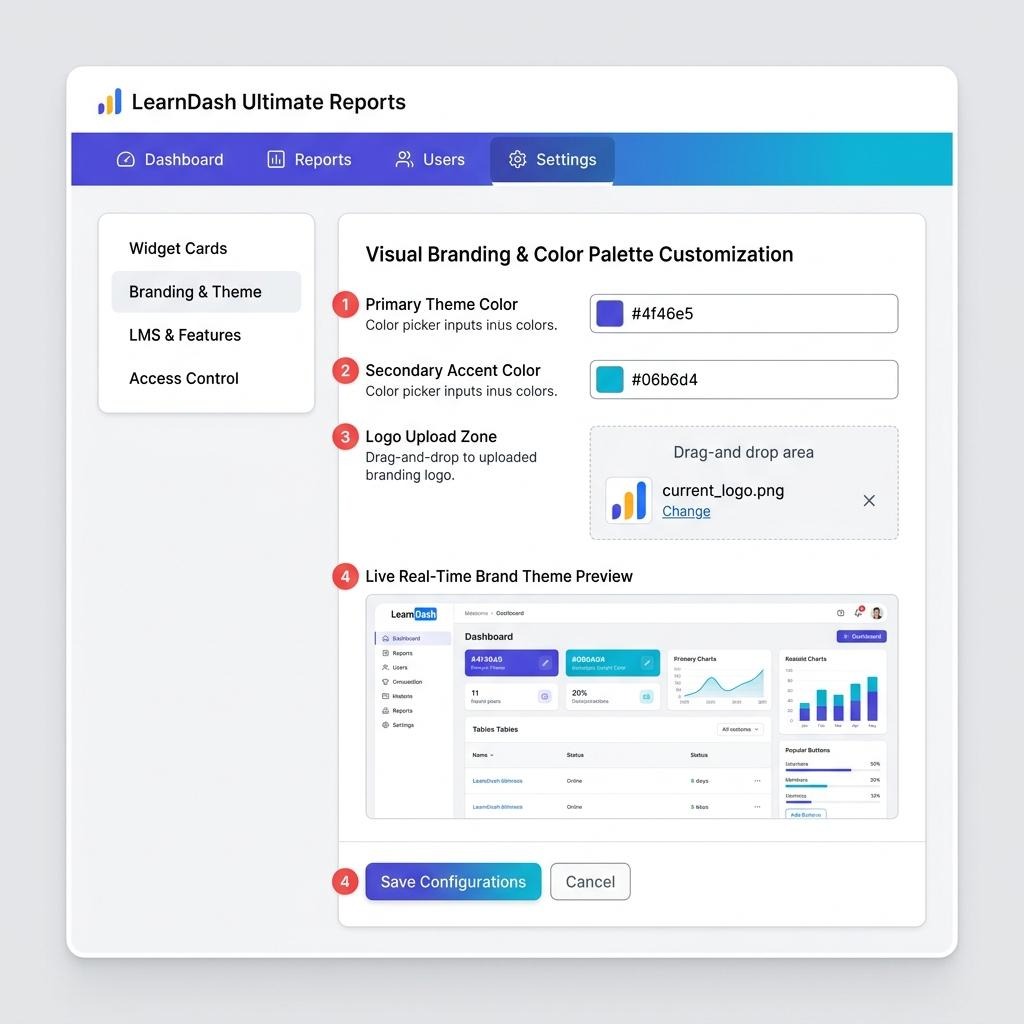
Figure 5: Plugin Settings Panel Mockup View
Settings Tabs Overview
- • Widget Cards: Selectively enable or disable widgets on the analytics dashboard tab.
- • Branding & Theme: Customize theme primary/secondary colors and upload custom logos with a real-time live preview panel.
- • LMS & Features: Control pagination limits, export types, popups, and frontend dashboard shortcode switches.
- • Access Control: Grants access to Group Leaders and Instructors, while Administrators maintain full control.
7. Shortcodes Reference
Embed the reporting grids on frontend pages by utilizing these shortcodes:
- [ld_dashboard]: Renders the complete statistics dashboard overview panel.
- [ld_user_report]: Renders the student progression reporting grid.
- [ld_course_report]: Renders the LMS course metrics reporting grid.
- [ld_group_report]: Renders the learning groups reporting grid.
- [ld_custom_report id=”X”]: Renders the custom built report configuration layout matching template ID X.
8. Developer & Database Reference
Configurations are stored in a custom database table name:
wp_ld_ultimate_reports
PSR-4 namespace mappings inside the plugin directory:
- • \LD\UltimateDashboard\Init -> src/Init.php
- • \LD\UltimateDashboard\Query -> src/Query.php
- • \LD\UltimateDashboard\Importer -> src/Importer.php
- • \LD\UltimateDashboard\Database -> src/Database.php